
Assessing clean energy supply chain risks requires applying the International Energy Agency’s structured methodology to identify geographic concentration, processing bottlenecks, and critical mineral dependencies across five key manufacturing segments. The IEA’s Energy Technology Perspectives 2026, released this year, reveals that every major clean energy technology contains at least one vulnerable supply chain link, posing significant threats to the global energy transition. This vulnerability isn’t theoretical. Solar PV supply chains, for instance, concentrate over 80% of polysilicon production in a single region, creating exposure to trade disruptions, price volatility, and geopolitical tensions that can derail decarbonization timelines.
The good news? The IEA has developed a practical assessment framework that energy professionals, policy makers, and sustainability advocates can apply to their own contexts. Using the agency’s solar PV case study as a blueprint, organizations can systematically evaluate risks across the complete value chain, from raw material extraction through manufacturing to end-of-life recycling. The methodology examines five distinct segments (polysilicon, ingots, wafers, cells, and modules) while considering job creation potential, investment requirements, manufacturing costs, emissions profiles, and circular economy opportunities.
This guide walks you through the IEA’s step-by-step process for conducting supply chain risk assessments, drawing on insights from the agency’s interactive database of 640 energy technology components and real-world applications. You’ll learn how to identify weak links before they become breaking points, enabling proactive mitigation strategies that strengthen supply security while advancing clean energy deployment goals.
Understanding the Clean Energy Supply Chain Landscape
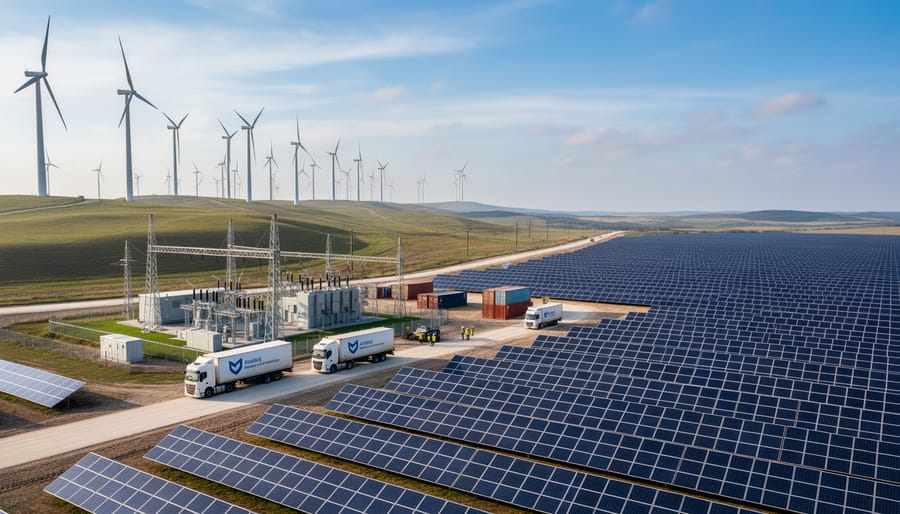
Clean energy supply chains encompass the complete journey of materials, components, and manufacturing processes that transform raw resources into the technologies powering our transition away from fossil fuels. These chains stretch from mineral extraction and refining through component fabrication, assembly, and eventual deployment, covering everything from solar panels and wind turbines to batteries, heat pumps, and electric vehicles. Unlike traditional energy infrastructure, clean energy technologies rely on precise engineering, specialized materials, and complex global manufacturing networks that must scale dramatically to meet climate targets.
The stakes couldn’t be higher. As countries commit to net-zero emissions and clean energy deployment accelerates, supply chains have become the physical backbone of the energy transition. Disruptions or bottlenecks at any point can delay projects, inflate costs, and undermine progress toward sustainability goals. Energy Technology Perspectives 2026, published by the IEA, puts a special focus on vulnerabilities in these supply chains, revealing that each key energy technology contains at least one weak link that poses significant risks to timely deployment.
To help professionals navigate this complexity, the IEA developed the ETP Clean Energy Technology Guide an interactive database covering 640 individual technology designs and components across the whole energy system. This resource provides granular visibility into how different clean energy technologies are manufactured, where production concentrates, and which segments face the greatest pressure. By mapping these intricate networks, the database enables energy professionals, policy makers, and industry stakeholders to identify dependencies, assess resilience, and develop targeted strategies for strengthening supply chains before vulnerabilities escalate into crises.
Tools and Data Resources for Supply Chain Analysis

Conducting a thorough supply chain risk assessment requires access to reliable data and analytical frameworks. The IEA has developed several comprehensive resources specifically designed to support this work, combining quantitative analysis with strategic insights that reflect real-world manufacturing complexities.
The cornerstone resource is Energy Technology Perspectives 2026, which examines vulnerabilities across the entire clean energy technology landscape. This report identifies weak links in supply chains and provides detailed analysis of concentration risks, manufacturing capacity, and trade dependencies. It serves as both a diagnostic tool for understanding current vulnerabilities and a strategic framework for thinking about resilience.
For granular technology-specific analysis, the ETP Clean Energy Technology Guide offers an interactive database covering 640 individual technology designs and components across the whole energy system. This database allows you to drill down into specific technologies, compare manufacturing processes, and understand interdependencies between different supply chain segments. You can explore production pathways, material requirements, and regional manufacturing capabilities at a level of detail that supports practical decision-making.
The Special Report on Solar PV Global Supply Chains provides the most comprehensive case study of supply chain dynamics available. It examines the five main manufacturing segments, polysilicon, ingots, wafers, cells, and modules, from raw materials to finished product, offering a methodology you can adapt to other technologies. The report assesses investment requirements, manufacturing costs, emissions profiles, recycling potential, and job creation impacts, making it valuable not just for understanding risks but for evaluating diversification opportunities.
Key IEA resources for supply chain analysis include:
- Energy Technology Perspectives 2026 report for cross-technology vulnerability assessment and strategic framework
- ETP Clean Energy Technology Guide interactive database for detailed component-level analysis of 640 technology designs
- Special Report on Solar PV Global Supply Chains for methodology and comprehensive case study approach
- Country-specific manufacturing data and capacity forecasts within ETP tools
- Trade flow analysis and geographic concentration metrics across technology segments
These resources work together as a toolkit. Start with Energy Technology Perspectives 2026 to understand the broader landscape and identify which technologies warrant deeper investigation. Use the interactive database to map specific supply chains and gather quantitative data. Apply the methodology from the Solar PV report to structure your assessment and ensure you’re considering all relevant dimensions, economic, environmental, and social, not just immediate production risks.
Critical Vulnerabilities to Watch For
Before diving into supply chain assessments, it’s crucial to recognize the systemic vulnerabilities that can undermine even the most promising clean energy projects. The IEA’s Energy Technology Perspectives 2026 reveals a stark reality: every key energy technology supply chain contains at least one weak link that poses genuine risks to the global energy transition.
Geographic concentration represents the most pressing vulnerability. When a single country or region dominates critical manufacturing stages, supply disruptions from trade tensions, natural disasters, or policy shifts can cascade through the entire value chain. The IEA’s Special Report on Solar PV Global Supply Chains demonstrates this clearly: examining the five main manufacturing segments, polysilicon, ingots, wafers, cells, and modules, reveals dangerous concentration at multiple points from raw materials to finished products.
Material shortages create another layer of risk. Certain clean energy technologies depend on minerals and metals with limited extraction capacity or concentrated deposits. As deployment accelerates, competition for these materials intensifies, potentially creating bottlenecks that slow manufacturing and drive up costs. This affects not only solar panels but also resilient batteries and wind turbines that require specific rare earth elements.
Manufacturing bottlenecks compound these challenges. Scaling production capacity takes years of capital investment, skilled workforce development, and technology transfer. The IEA’s analysis across 640 individual technology designs in their ETP Clean Energy Technology Guide database shows that weak links can appear anywhere along the manufacturing chain, not just in raw material extraction. Investment gaps, technological barriers, and competitive dynamics all contribute to capacity constraints that limit how quickly clean energy deployment can scale globally.
Step-by-Step Supply Chain Risk Assessment Process

Step 1: Map the Complete Manufacturing Chain
Start by identifying every discrete step in the manufacturing process, from raw material extraction to the final product ready for installation. The IEA’s solar PV analysis provides the clearest template: trace the chain through five distinct stages, each with its own inputs, processes, and outputs.
Begin with raw material processing. For solar PV, this means polysilicon production, where quartzite or other silica sources are refined into high-purity silicon. Document the chemical processes, energy requirements, and quality specifications at this foundational stage.
Next, map intermediate manufacturing steps. In solar PV, polysilicon becomes ingots through crystallization, then ingots are sliced into wafers. Each transformation requires specialized equipment, specific technical expertise, and substantial capital investment. Record the manufacturing yield rates and waste streams at each transition point.
Then trace component assembly. Solar wafers are processed into cells through doping and metallization, adding the electrical properties needed for power generation. Finally, cells are assembled into modules with glass, frames, and junction boxes. These five solar PV manufacturing segments demonstrate how a complete supply chain breaks down into analyzable units.
Document the technical specifications, quality standards, and certification requirements that govern handoffs between segments. This mapping reveals where bottlenecks form and dependencies concentrate.
Step 2: Assess Supply, Demand, and Production Dynamics
Once you’ve mapped the manufacturing chain, the next task is to analyze whether each segment can meet projected demand. Start by gathering production capacity data for each manufacturing stage, the IEA’s Solar PV Global Supply Chains report provides this for polysilicon, ingots, wafers, cells, and modules, showing where current capacity sits relative to forecasted needs.
Compare these capacity figures against demand projections tied to climate targets and deployment scenarios. The IEA’s Energy Technology Perspectives 2026 offers sector-wide forecasts that help you spot mismatches. Look for segments where capacity expansion lags demand growth, these are your bottleneck candidates.
Calculate the capacity utilization rate at each stage by dividing actual production by total installed capacity. High utilization rates (above 85%) signal limited headroom for growth, while very low rates may indicate overcapacity or market distortions. Track announced expansion projects and their timelines, but discount plans lacking firm investment commitments.
Pay attention to lead times for scaling production. Manufacturing equipment for upstream segments like polysilicon can take two to three years to procure and install, creating delayed response to demand surges. Cross-reference your findings with trade data showing import-export flows between manufacturing hubs, as mismatches often hide in regional imbalances rather than global totals.
Step 3: Evaluate Costs and Investment Requirements
Economic analysis forms the backbone of understanding supply chain resilience. Start by examining manufacturing costs at each segment, polysilicon production, ingot and wafer fabrication, cell manufacturing, and module assembly each carry distinct cost structures. The IEA’s solar PV analysis reveals these costs vary dramatically by region and production scale, with China achieving significantly lower costs through economies of scale and vertical integration.
Next, calculate capital investment requirements for new or expanded capacity. Building a polysilicon facility requires billions in upfront capital, while module assembly plants need comparatively modest investment. Map these financial barriers against projected demand growth to identify where investment shortfalls could create bottlenecks. The IEA framework shows that high capital intensity in upstream segments creates natural concentration risks because few regions can mobilize the necessary funds.
Assess financial performance metrics including profit margins, return on investment, and break-even timelines. When margins compress in specific segments, as happened in polysilicon during oversupply periods, manufacturers exit the market, reducing capacity and creating future vulnerability. Track how price fluctuations and policy changes affect profitability across the chain to anticipate where economic stress might trigger supply disruptions or consolidation that increases concentration risk.
Step 4: Identify Geographic and Trade Vulnerabilities
Start by creating a geographic heat map of production facilities, mining operations, and manufacturing capacity for each supply chain segment. Use the IEA’s Special Report data to quantify concentration ratios, for example, examining solar manufacturing concentration across the five segments (polysilicon, ingots, wafers, cells, modules). Calculate the percentage of global capacity held by the top three producing countries for each segment.
Next, map critical trade routes and identify chokepoints where raw materials or semi-finished components must cross borders. Document import dependencies for countries planning to scale clean energy deployment. The US vs. China solar manufacturing dynamic illustrates how geopolitical tensions can create supply continuity risks even when capacity exists.
Finally, overlay geopolitical risk factors: trade policy uncertainty, export restrictions, tariff barriers, and political stability in producing regions. Assign vulnerability scores based on how many alternative suppliers exist for each segment and how quickly production could shift if a primary source became unavailable.
Step 5: Analyze Environmental and Social Factors
Supply chain risk extends beyond manufacturing efficiency and cost. A complete assessment must include environmental and social factors that affect both sustainability credentials and long-term viability. The IEA’s solar PV analysis provides a tested framework.
Start with emissions profiles across each manufacturing segment. For solar PV, the IEA examines carbon intensity from polysilicon production through module assembly, revealing where geographic shifts could reduce or increase the technology’s environmental footprint. Compare energy sources powering each facility and calculate total lifecycle emissions, not just operational output.
Next, evaluate recycling potential and material circularity. Assess what percentage of materials can be recovered at end-of-life, existing infrastructure for collection and processing, and technological readiness for scaling recycling operations. The solar PV case demonstrates how recycling capacity in different regions affects supply security.
Finally, quantify employment impacts. The IEA framework measures clean energy jobs created per gigawatt of capacity across manufacturing segments, installation, and maintenance. This reveals which diversification strategies deliver broader economic benefits alongside supply security, helping policymakers balance industrial development goals with resilience objectives.
Evaluating Diversification Opportunities and Challenges
Evaluating diversification requires a systematic approach that balances opportunity against practical constraints. Start by mapping existing concentration points from your Step 4 analysis, these are your diversification priorities. If 80% of wafer production sits in one country, that segment demands immediate attention.
Assess new manufacturing locations by examining three factors: infrastructure readiness, energy costs, and market proximity. Countries with existing semiconductor manufacturing often have transferable capabilities for solar PV production. Calculate the total landed cost for each potential location, not just labor rates. A factory in a low-wage region loses its advantage if it’s 6,000 miles from major markets with inadequate port facilities.
Evaluate alternative materials and processes against incumbent technologies. Perovskite solar cells offer potential diversification from silicon-based PV, but they face durability challenges that keep them years from commercial scale. When the IEA analyzes emerging technologies, they weigh technological maturity against investment timelines, you should do the same. Don’t chase alternatives that won’t reach commercial viability within your planning horizon.
Quantify investment requirements realistically. The IEA’s solar PV analysis reveals that building competitive manufacturing capacity requires billions in capital, specialized equipment with 12-18 month lead times, and years to reach cost parity with established producers. A new polysilicon plant might need $1-2 billion and three years before producing its first commercial-grade material.
Understand competitive dynamics that shape diversification success. Established manufacturers benefit from learning curves, economies of scale, and vertical integration that new entrants struggle to match. China’s solar PV dominance stems partly from coordinated industrial policy supporting the entire value chain. A standalone factory in a new region faces steeper challenges than an integrated cluster.
Examine policy mechanisms that enable or hinder diversification. Production tax credits, local content requirements, and research funding can offset cost disadvantages for emerging manufacturing hubs. The IEA’s assessment of solar PV supply chains explicitly considers how different policy frameworks affect investment decisions and competitive positioning.
Balance diversification speed against quality. Rushing new capacity online often means accepting higher costs, lower yields, and technological gaps that take years to close.
Frequently Asked Questions
The IEA framework for assessing clean energy supply chain risks raises practical questions for energy professionals and policy makers implementing this methodology. These answers draw from the findings in Energy Technology Perspectives 2026 and the Special Report on Solar PV Global Supply Chains to address the most common concerns.
What makes a clean energy supply chain vulnerable?
Vulnerabilities arise from geographic concentration of manufacturing, dependence on limited raw material sources, bottlenecks in specialized production steps, and insufficient diversification across suppliers. The IEA’s 2026 analysis shows that every key energy technology supply chain contains at least one weak link.
Which clean energy technologies face the greatest supply chain risks?
Technologies with highly concentrated manufacturing bases and complex multi-stage production processes face elevated risks. Solar PV exemplifies this pattern, with five critical manufacturing segments, polysilicon, ingots, wafers, cells, and modules, each presenting distinct vulnerabilities that the IEA’s Special Report examined in depth.
How quickly can supply chain diversification be achieved?
Diversification timelines vary by technology and manufacturing segment, typically requiring several years for new production capacity to come online. Barriers include substantial capital investment requirements, technological expertise gaps, and the need to develop supporting infrastructure and supplier networks in new locations.
What role can policy makers play in mitigating supply chain risks?
Policy makers can support diversification through industrial development incentives, investment in workforce training, research and development funding, and trade policies that encourage resilient supply networks. The IEA framework helps governments identify where strategic interventions will have the greatest impact on reducing systemic vulnerabilities.
Understanding these practical aspects helps organizations apply the IEA methodology effectively. The interactive ETP Clean Energy Technology Guide database, covering 640 individual technology designs and components across the whole energy system, provides additional context for technology-specific questions. When conducting your own assessments, remember that supply chain dynamics evolve continuously as new manufacturing capacity develops, trade relationships shift, and technologies mature. Regular reassessment using the IEA framework ensures your mitigation strategies remain aligned with current realities rather than outdated assumptions about production locations or capacity constraints.
The assessment process also surfaces opportunities alongside risks. Evaluating job creation potential, recycling pathways, and emissions profiles during your supply chain analysis, as the IEA demonstrated in the solar PV case study, reveals where diversification efforts can deliver multiple benefits beyond risk reduction alone.
The energy transition will succeed or fail not just on technology innovation, but on the resilience of the supply chains that deliver clean energy solutions at scale. As the IEA’s Energy Technology Perspectives 2026 makes clear, every key energy technology supply chain contains at least one weak link. These vulnerabilities threaten deployment timelines, increase costs, and could derail progress toward climate goals if left unaddressed.
Using the IEA framework outlined in this guide gives energy professionals and policy makers a proven methodology for identifying and mitigating these risks before they become crises. The solar PV case study demonstrates how systematic assessment across raw materials, manufacturing segments, geographic dependencies, and environmental factors reveals both immediate threats and long-term opportunities for diversification.
This isn’t theoretical work. Supply chain resilience directly determines whether countries can meet their energy transition commitments, whether companies can deliver projects on schedule, and whether the world can deploy clean energy infrastructure fast enough to matter. The assessment tools and step-by-step process covered here provide actionable starting points for your own planning.
Apply this framework to the technologies most critical to your operations or policy priorities. Map the vulnerabilities, quantify the risks, and develop diversification strategies before market disruptions force reactive decisions. The data exists, the methodology works, and the urgency couldn’t be clearer.