
The U.S. solar power sector continues its exceptional growth trajectory, with the nation adding 7.8 GW of new solar capacity in the first quarter of 2026 and surpassing 6 million cumulative installations. This milestone reflects the industry’s evolution from emerging technology to dominant force in grid expansion, where solar and storage now represent 91% of all new capacity additions.
The numbers tell a story of sustained momentum. Third-quarter 2025 installations reached 11.7 GW, marking a 20% year-over-year increase, while developers have announced plans to deploy 43.4 GW of utility-scale solar in 2026 alone. If realized, that would represent a 60% jump in capacity additions compared to the previous year.
These developments signal more than incremental progress. The solar industry has reached a scale where quarterly installations rival the total annual capacity of entire countries just a decade ago. Energy professionals and policymakers are watching closely as this growth tests grid integration capabilities, supply chain resilience, and the ability to maintain installation velocity amid evolving economic conditions.
What’s driving this expansion, and can the pace hold? The latest data points to several factors shaping the sector’s trajectory, from utility-scale project pipelines to distributed generation trends. Understanding these dynamics matters for anyone involved in energy planning, investment decisions, or sustainability strategy. The decisions made now will determine whether the industry’s ambitious targets translate into operational reality or remain aspirational forecasts.
What Changed: Major Solar Industry Milestones
Between Q3 2025 and Q1 2026, the U.S. solar industry delivered measurable evidence of accelerating market penetration. The third quarter of 2025 saw installations reach 11.7 GW, marking a 20% year-over-year increase that reflected strengthened supply chains and maturing project pipelines. This momentum carried into early 2026, when the nation added 7.8 GW of new solar capacity while solar and storage captured 91% of all new grid additions.
The quarter also marked the U.S. surpassing 6 million cumulative solar installations, a threshold that underscores the technology’s evolution from alternative energy source to mainstream grid asset. Looking ahead, developers have committed to adding 43.4 GW of new utility-scale capacity in 2026, which would represent a 60% increase over 2025 deployment if realized. This ambitious pipeline sets the stage for examining what drove these gains and what challenges could shape their continuation.
Key Developments Shaping the Solar Landscape
1. Record-Breaking Q3 2025 Installations Signal Acceleration
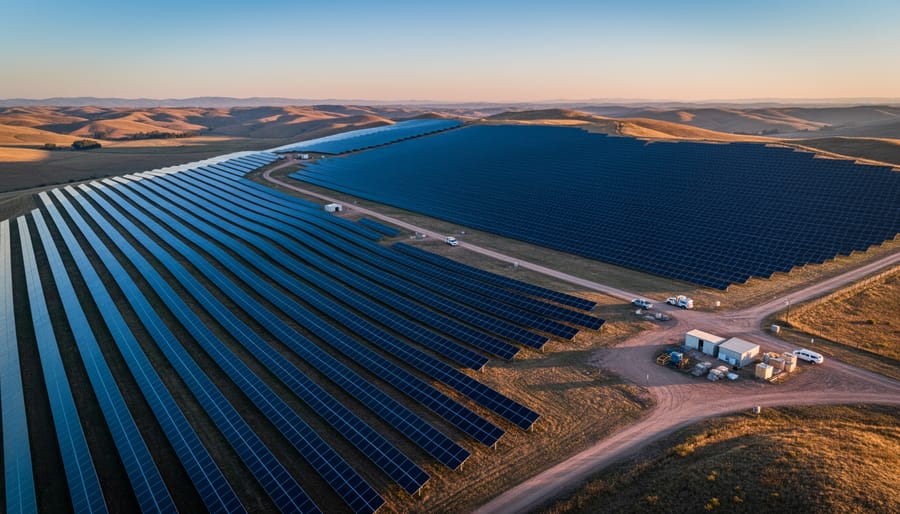
The third quarter of 2025 marked a turning point for solar deployment, with the industry installing 11.7 GW in Q3 2025 a 20% jump over the same period in 2024. This surge exceeded most analyst projections and signaled that the sector had finally broken through persistent bottlenecks that had constrained growth in previous years.
What drove this acceleration? Multiple factors converged to create favorable conditions for large-scale deployment:
- Maturation of project pipelines that had been delayed by interconnection queue backlogs, bringing previously stalled utility-scale projects online
- Supply chain stabilization following years of component shortages, particularly in inverters and racking systems tied to solar manufacturing 2026 capacity expansions
- Installation workforce growth that enabled developers to execute projects faster, with experienced labor pools expanding in key solar markets
- Developer confidence strengthened by clearer long-term policy frameworks and utility procurement commitments extending through the decade
The quarter’s performance revealed genuine deployment capacity rather than a one-time spike. Developers demonstrated they could move projects from planning to operation more efficiently, while installers showed they had the crews and equipment to handle higher throughput. Supply chains delivered components on schedule, reducing the force majeure delays that had plagued earlier periods.
This acceleration reflected years of infrastructure building finally paying off. The 20% year-over-year increase wasn’t just about installing more panels, it showed an industry that had solved fundamental execution challenges and built the capacity to sustain higher deployment rates going forward.
2. Solar and Storage Dominate New Grid Capacity in Early 2026
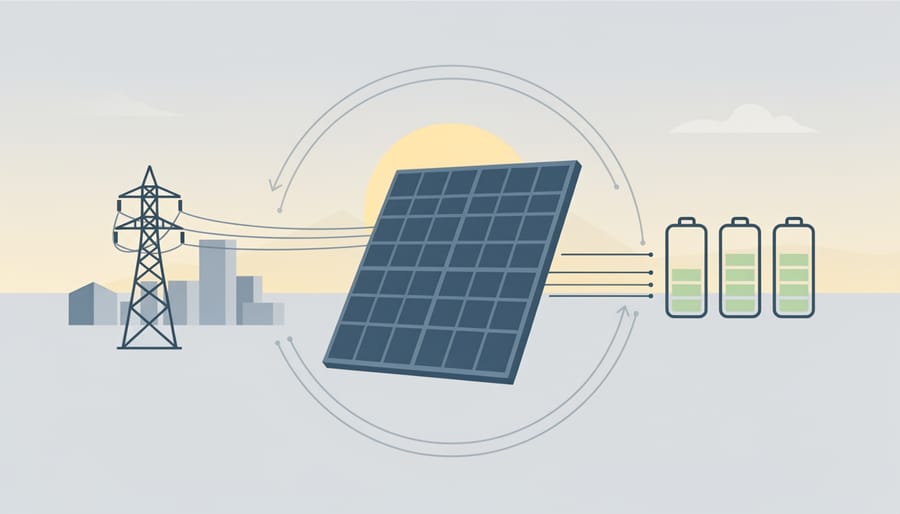
The first quarter of 2026 delivered a seismic shift in U.S. grid expansion: 91% came from solar and storage combined, while the nation installed 7.8 GW of new solar capacity. That commanding market share represents far more than incremental growth. It signals a fundamental reordering of how utilities and grid operators plan for future capacity needs.
Traditional generation sources now occupy the margins of new capacity procurement. Where coal retirements once triggered debates about replacement baseload, utilities increasingly turn to solar paired with battery storage to meet both peak demand and reliability requirements. The 91% figure reflects not just developer preference but also the economics driving utility decision-making: solar and storage projects deliver predictable costs, faster construction timelines, and zero fuel risk compared to conventional alternatives.
Grid planning models that assumed thermal generation would anchor new capacity for another decade face rapid obsolescence. Independent system operators now structure interconnection studies and transmission upgrades around solar-dominant scenarios, recognizing that the queue of planned projects tilts heavily toward renewables plus storage. This shift forces rethinking of reserve margins, frequency response capabilities, and seasonal adequacy calculations.
The implications extend to procurement strategy. Utilities issuing requests for proposals report overwhelming responses from solar and storage developers, often receiving bids at price points that make fossil alternatives uncompetitive without subsidies. The volume of solar capacity coming online in Q1 2026 also demonstrates that supply chain constraints, while not eliminated, no longer throttle deployment at scale. As solar and storage cement their position as the default choice for grid expansion, the industry faces a new question: not whether this technology mix will dominate, but how quickly the grid can adapt to absorb it.
3. Six Million Installations Mark New Era of Market Maturity
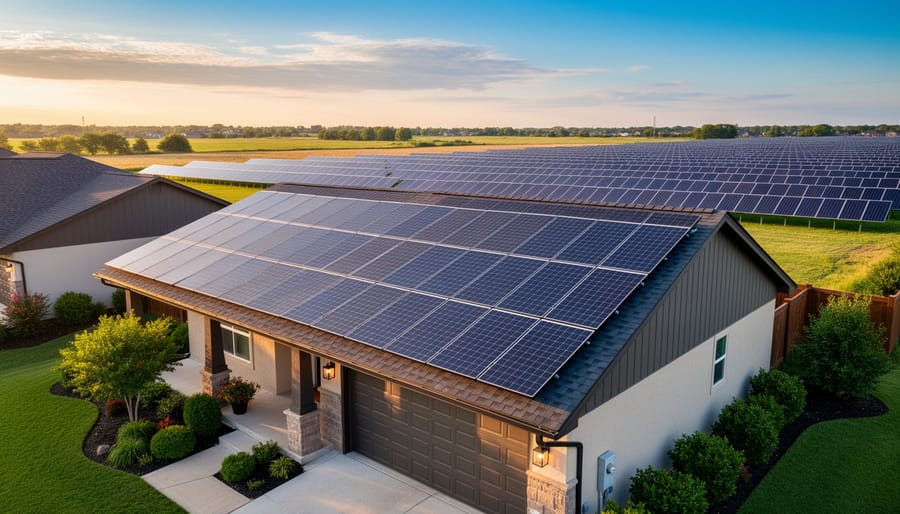
The United States surpassed six million installs in Q1 2026, marking a transition from niche technology to mainstream energy infrastructure. This cumulative figure encompasses residential rooftop arrays, commercial installations on warehouses and office buildings, and utility-scale solar farms that now power millions of homes.
The six million threshold reflects fundamentally different market dynamics than existed even five years ago. Residential solar has penetrated suburban and increasingly rural markets where it was once rare, driven by declining equipment costs and streamlined permitting in key states. Commercial installations have expanded beyond California and the Northeast into previously untapped regions as corporations pursue sustainability targets and energy cost predictability. Utility-scale projects account for the largest share of total capacity given their size, yet the distributed generation segments demonstrate solar’s versatility across use cases.
Regional variation remains pronounced. States with established renewable portfolio standards and net metering policies claim the majority of installations, while markets with less supportive frameworks lag despite comparable solar resources. The Southeast has seen accelerating growth in utility-scale deployments even as rooftop adoption trails behind. Western states continue to dominate residential installations per capita, but the Midwest is closing the gap as financing mechanisms improve and installer networks expand.
This breadth of adoption signals market maturity. Solar is no longer confined to early adopters or specific geographies, it has become a standard consideration in energy planning across sectors and regions.
4. Ambitious Utility-Scale Pipeline Projects 60% Growth
The industry’s ambition has never been clearer: developers plan to bring a 43.4 GW solar pipeline online in 2026, a figure that would mark a 60% leap from the previous year’s installations. This aggressive target reflects developer confidence, robust project financing availability, and the maturation of a substantial backlog that has moved through preliminary development stages. The scale of this pipeline signals more than incremental growth; it represents a fundamental acceleration in how quickly the industry can move projects from planning to commercial operation.
Whether this target materializes depends on several concrete factors. Interconnection queue processing speeds remain a critical bottleneck, with grid operators working through requests that have piled up faster than administrative capacity can clear them. Developers with projects already holding signed power purchase agreements and completed environmental reviews stand the best chance of hitting 2026 commissioning dates. Supply chain capacity has improved markedly compared to 2023’s constraints, with domestic manufacturing expansion reducing lead times for key components.
What makes this pipeline particularly significant is its composition. A substantial portion consists of hybrid solar-plus-storage projects rather than standalone generation, reflecting utility procurement preferences for dispatchable renewable capacity. The geographic distribution also matters: developers have concentrated planned capacity in states with streamlined permitting processes and robust transmission infrastructure, learning from delays that plagued earlier projects in regions with less developed interconnection procedures.
Why These Developments Matter
The acceleration documented in recent quarters extends far beyond industry scorecards. For grid operators, the influx of 7.8 GW in Q1 2026 alone, with solar and storage claiming 91% of new capacity, fundamentally reshapes dispatch economics and reliability planning. Traditional baseload assumptions no longer hold when renewables dominate the interconnection queue. System operators must now design around variable generation patterns, upgrade transmission infrastructure to accommodate distributed resources, and develop more sophisticated forecasting tools to maintain stability across increasingly complex networks.
Energy costs feel the impact across the value chain. Wholesale power prices compress during peak solar production hours, a pattern that benefits industrial users with flexible operations but challenges utilities built around conventional generation revenue models. The scale of planned deployment, 43.4 GW targeted for 2026 if realized, suggests these price effects will intensify. Lower daytime electricity costs ripple through manufacturing competitiveness calculations and influence where energy-intensive industries choose to locate facilities.
Carbon reduction trajectories shift materially when solar installations accelerate this quickly. The 20% year-over-year growth in Q3 2025 capacity translates directly to avoided emissions as each new gigawatt displaces fossil generation. Reaching 6 million cumulative installations marks a threshold where solar’s contribution to decarbonization goals becomes structurally significant rather than aspirational. Climate commitments that seemed ambitious when set now appear increasingly achievable as deployment outpaces earlier projections.
Workforce development faces acute pressure. The installation pipeline requires electricians, project managers, engineers, and construction crews at volumes that existing training programs struggle to supply. Manufacturing expansion to support 60% annual growth creates parallel demand for factory workers, quality control specialists, and supply chain professionals. Investment capital follows this momentum, developers, equipment manufacturers, and installation contractors all compete for financing against a backdrop where project economics look increasingly favorable but execution capacity remains constrained.
The ripple effects touch ancillary sectors few outside the industry notice. Inverter manufacturers, racking system suppliers, monitoring software developers, and specialized insurance providers all experience demand surges tied to primary installation volumes. This ecosystem expansion creates economic activity and employment well beyond the solar panels themselves.
What to Watch: Critical Factors Ahead
The industry’s recent achievements set an impressive baseline, but sustaining this trajectory depends on how quickly several critical systems adapt to accommodate rapid solar expansion. Whether the ambitious 43.4 GW utility-scale target for 2026 materializes, and whether subsequent years maintain this pace, hinges on factors that extend well beyond developer intentions or financing availability.
Interconnection reform stands as perhaps the most consequential variable. The queue backlog has historically created multi-year delays between project conception and commercial operation, and the sheer volume of planned capacity will test whether recent process improvements can handle the load. Faster, more transparent interconnection procedures directly determine how many megawatts move from pipeline to production.
Supply chain resilience remains equally vital, particularly as the energy transition accelerates demand for modules, inverters, and mounting systems. Diversified sourcing, domestic manufacturing expansion, and adequate inventory buffers will determine whether projects face cost escalations or procurement delays that derail deployment schedules.
Storage integration is now standard rather than optional for most utility-scale projects, fundamentally reshaping the grid. Battery attachment rates, duration requirements, and dispatch strategies will define how effectively solar capacity contributes to grid reliability during peak demand periods and evening hours when generation tapers.
Monitor these specific indicators for early signals of market direction:
- Interconnection queue processing times and approval rates at major regional transmission organizations
- Module pricing trends and manufacturing capacity announcements from domestic facilities
- Storage attachment rates for newly approved utility-scale projects
- Utility integrated resource plans and renewable procurement targets
- Workforce training program expansions and certification completion rates
Market design adaptations will also shape outcomes. Time-of-use rates, capacity market rules, and renewable energy credit structures influence where and how developers deploy projects. Workforce availability presents a more tangible constraint, qualified installers, electricians, and project managers must scale proportionally with deployment ambitions, making training program capacity a leading indicator of sustainable growth.
Common Questions About Solar Industry Growth
What’s the difference between gigawatts DC and AC in solar capacity measurements?
Direct current (DC) measures the power solar panels generate at their output, while alternating current (AC) reflects the usable power after inverter conversion. Industry reports typically use DC capacity because it represents the solar resource itself, though AC capacity better reflects grid contribution after accounting for inverter and system losses.
How does the industry count solar installations?
Each discrete solar energy system counts as one installation, whether it’s a rooftop array on a home, a commercial building’s solar setup, or a utility-scale solar farm. The 6 million cumulative installations milestone in Q1 2026 represents individual systems across all these segments, not the number of solar panels deployed.
What does utility-scale versus distributed generation mean?
Utility-scale projects are large solar farms that feed power directly into the transmission grid, typically exceeding 5 MW in capacity. Distributed generation includes residential rooftops and commercial installations that generate power at or near the point of use, connecting to local distribution networks rather than the bulk power system.
How long does it take for planned solar capacity to become operational?
Development timelines vary widely based on project size, interconnection queue position, permitting requirements, and financing arrangements. Utility-scale projects typically require two to four years from initial planning to commercial operation, which explains why the planned 43.4 GW for 2026 depends on projects already well into development.
What factors most influence whether planned capacity gets built?
Interconnection approval, equipment availability, labor force capacity, and project financing create the primary bottlenecks. Grid connection timelines have become particularly critical, with some projects waiting years for study completion and approval to connect, regardless of having secured the best solar panels and construction financing.
These technical distinctions matter because they affect how stakeholders interpret growth figures and set realistic deployment expectations. The 20% year-over-year increase in Q3 2025 installations reflects projects that began development years earlier, not a sudden acceleration in planning activity. Understanding these measurement standards and development rhythms helps energy professionals distinguish between genuine momentum and statistical noise in quarterly reports.
The solar power industry’s trajectory through early 2026 demonstrates more than incremental progress, it reflects a fundamental shift in how the United States generates electricity. The 11.7 GW installed in Q3 2025, followed by solar and storage capturing 91% of new grid capacity in Q1 2026, signals that renewable energy has moved from alternative to mainstream. Yet converting ambitious plans into operational capacity remains the critical challenge. The 43.4 GW of utility-scale solar planned for 2026 represents a 60% increase over 2025, but translating developer commitments into energized projects depends on interconnection reforms, supply chain stability, and skilled workforce availability.
What’s clear is that solar’s expanding role in the energy mix isn’t a future possibility, it’s the present reality. With over 6 million cumulative installations now operational, the infrastructure for a decarbonized grid is taking tangible form. The question isn’t whether solar will play a central role in meeting sustainability goals, but how quickly the industry can execute at the scale these ambitions demand.